
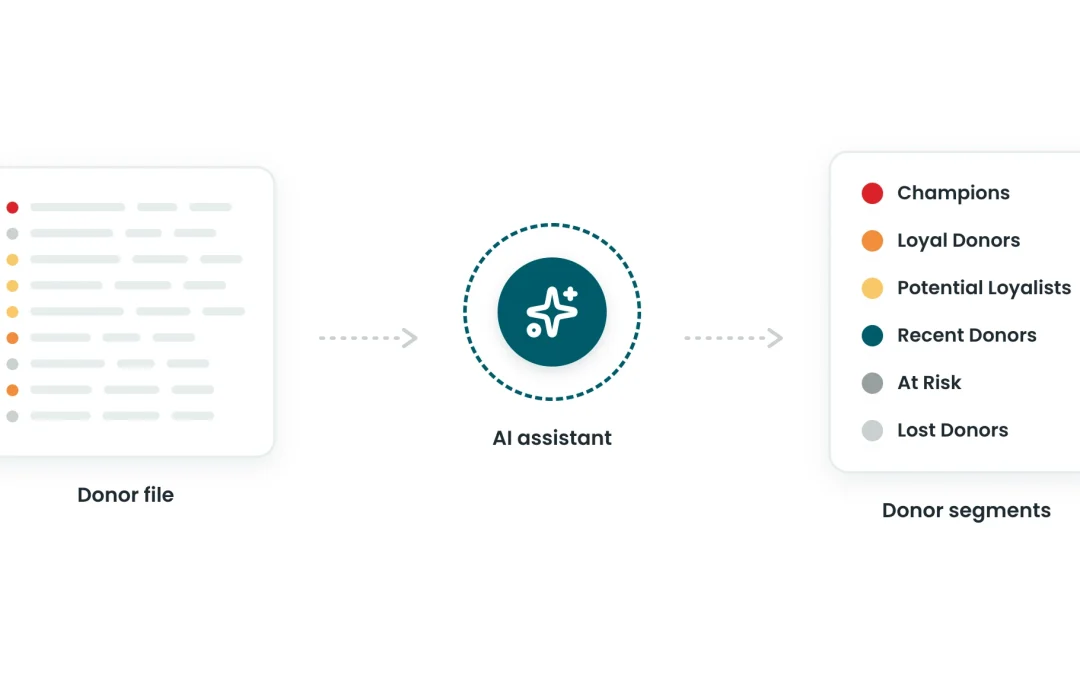
I’m not a spreadsheet expert, and my coding skills are non-existent. I still ran a full RFM analysis on a donor file, with an AI assistant doing the heavy lifting.
I first tried this for one of CharityCAN’s AI Office Hours webinars, where we look at practical ways prospect researchers can use AI. The goal was simple: see whether an AI assistant could run a Recency, Frequency, Monetary (RFM) analysis without me writing a single formula.
A year later, the tools have only gotten better. Uploading a spreadsheet and asking an assistant to analyze it is now an everyday task, and most AI assistants can work with files directly. The process below isn’t tied to any one platform. It’s a useful template for anyone who wants to try this with their own data.
Choosing the Dataset
I wanted something clean, public and manageable. I settled on federal political contributions to the Green Party of Canada going back to 2022.
I pulled the data from CharityCAN (I have an account 😉). Elections Canada would have worked too, since federal political contributions are public in Canada.
Uploading and Cleaning the Data
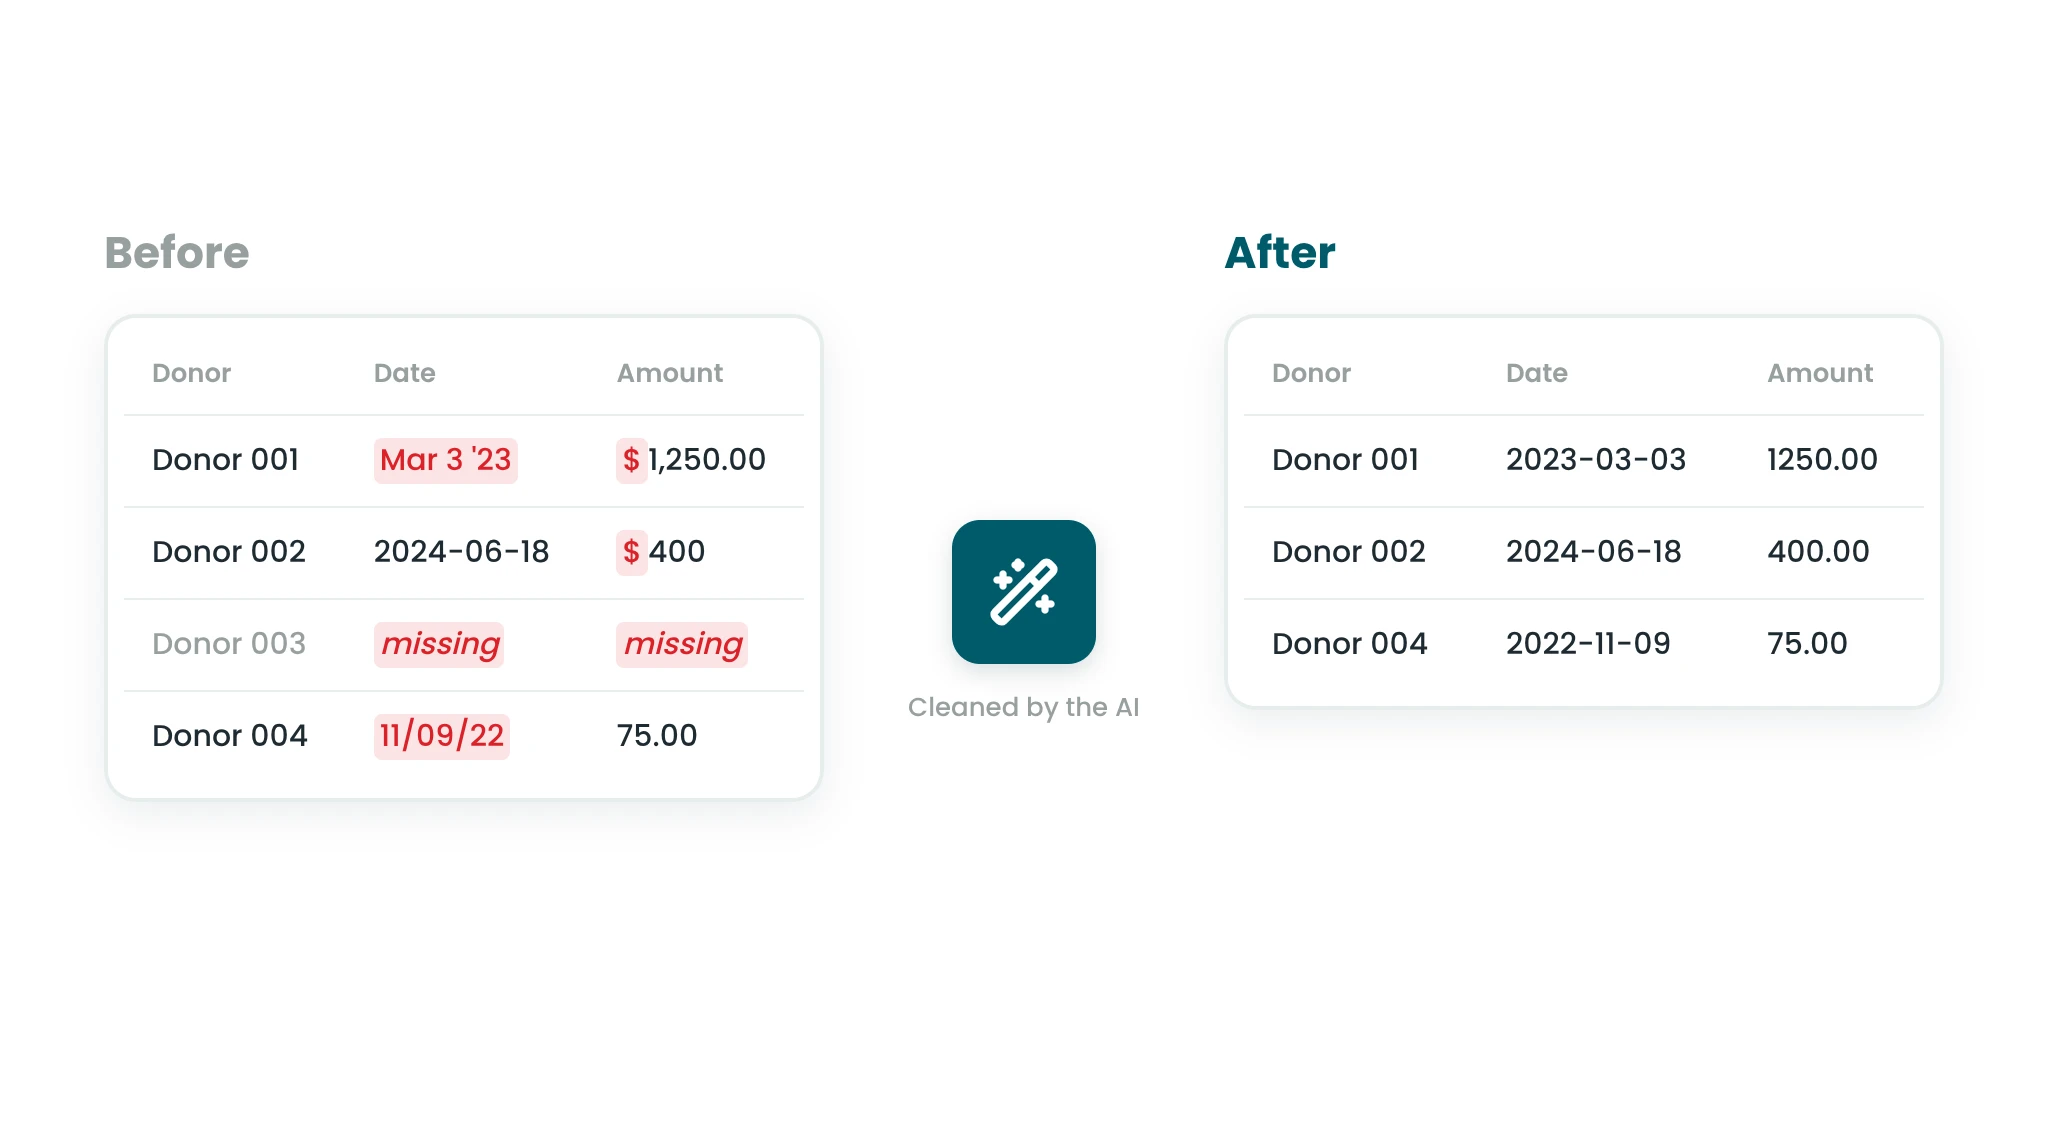
I uploaded a basic spreadsheet with donor names, donation dates, donation amounts and recipient organizations. The AI helped me inspect and clean it:
- Removing formatting issues, such as dollar signs in the amount field
- Converting dates to a consistent format
- Dropping incomplete or irrelevant rows
This step is crucial, and the AI handled it quickly. It would have taken me at least a few hours on my own. And let’s be honest, it isn’t fun work.
Running the Numbers
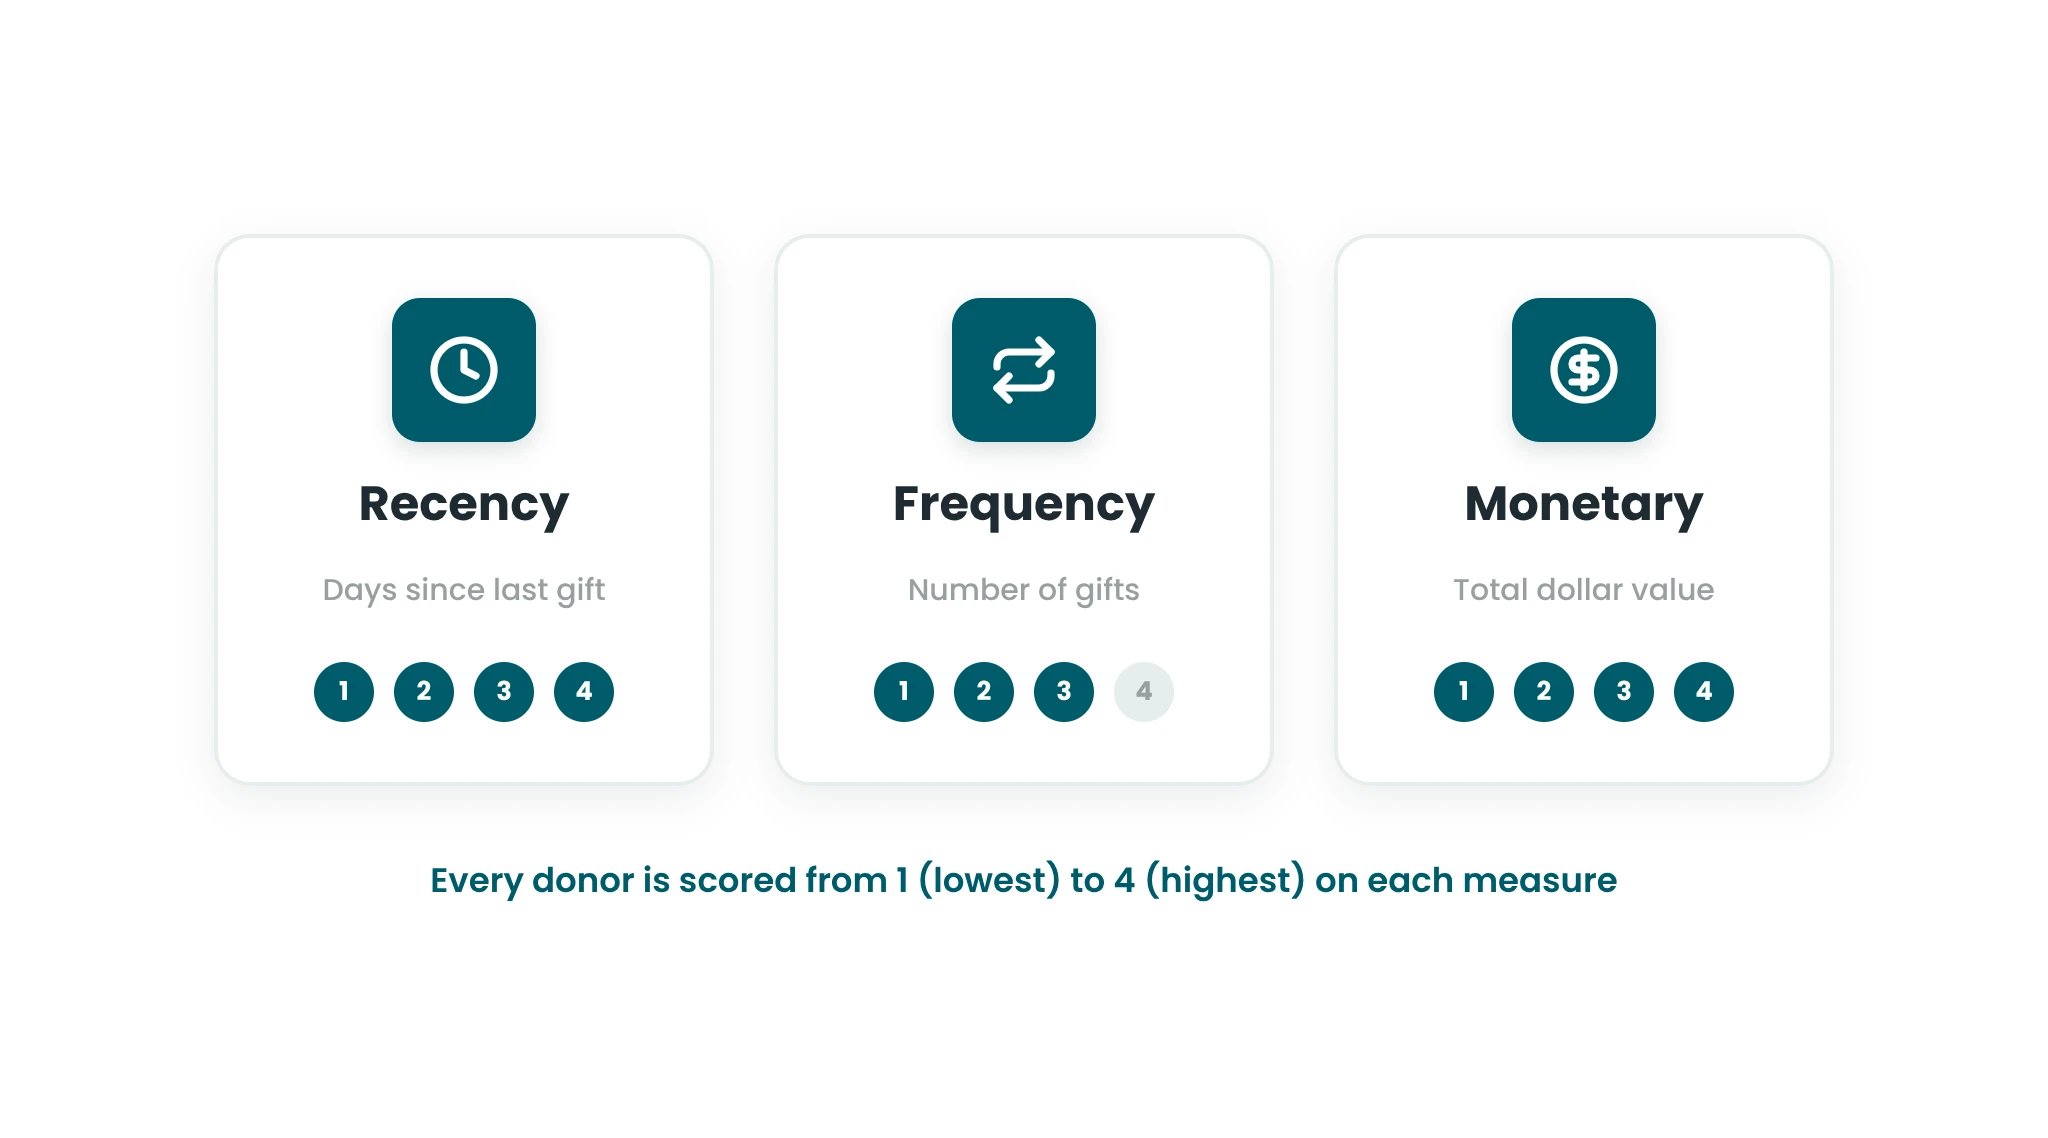
With the data cleaned up, I asked the AI to calculate the three RFM numbers:
- Recency: days since a donor’s last gift
- Frequency: number of gifts the donor has made
- Monetary: total dollar value of all gifts
It grouped the data by donor and calculated each number. Then we scored every donor from 1 (lowest) to 4 (highest) on each measure.
Creating Donor Segments
After each step, I had the AI prepare the file for download so I could review its changes. After scoring, it prepared the sheet and then suggested segmenting the donors on its own.
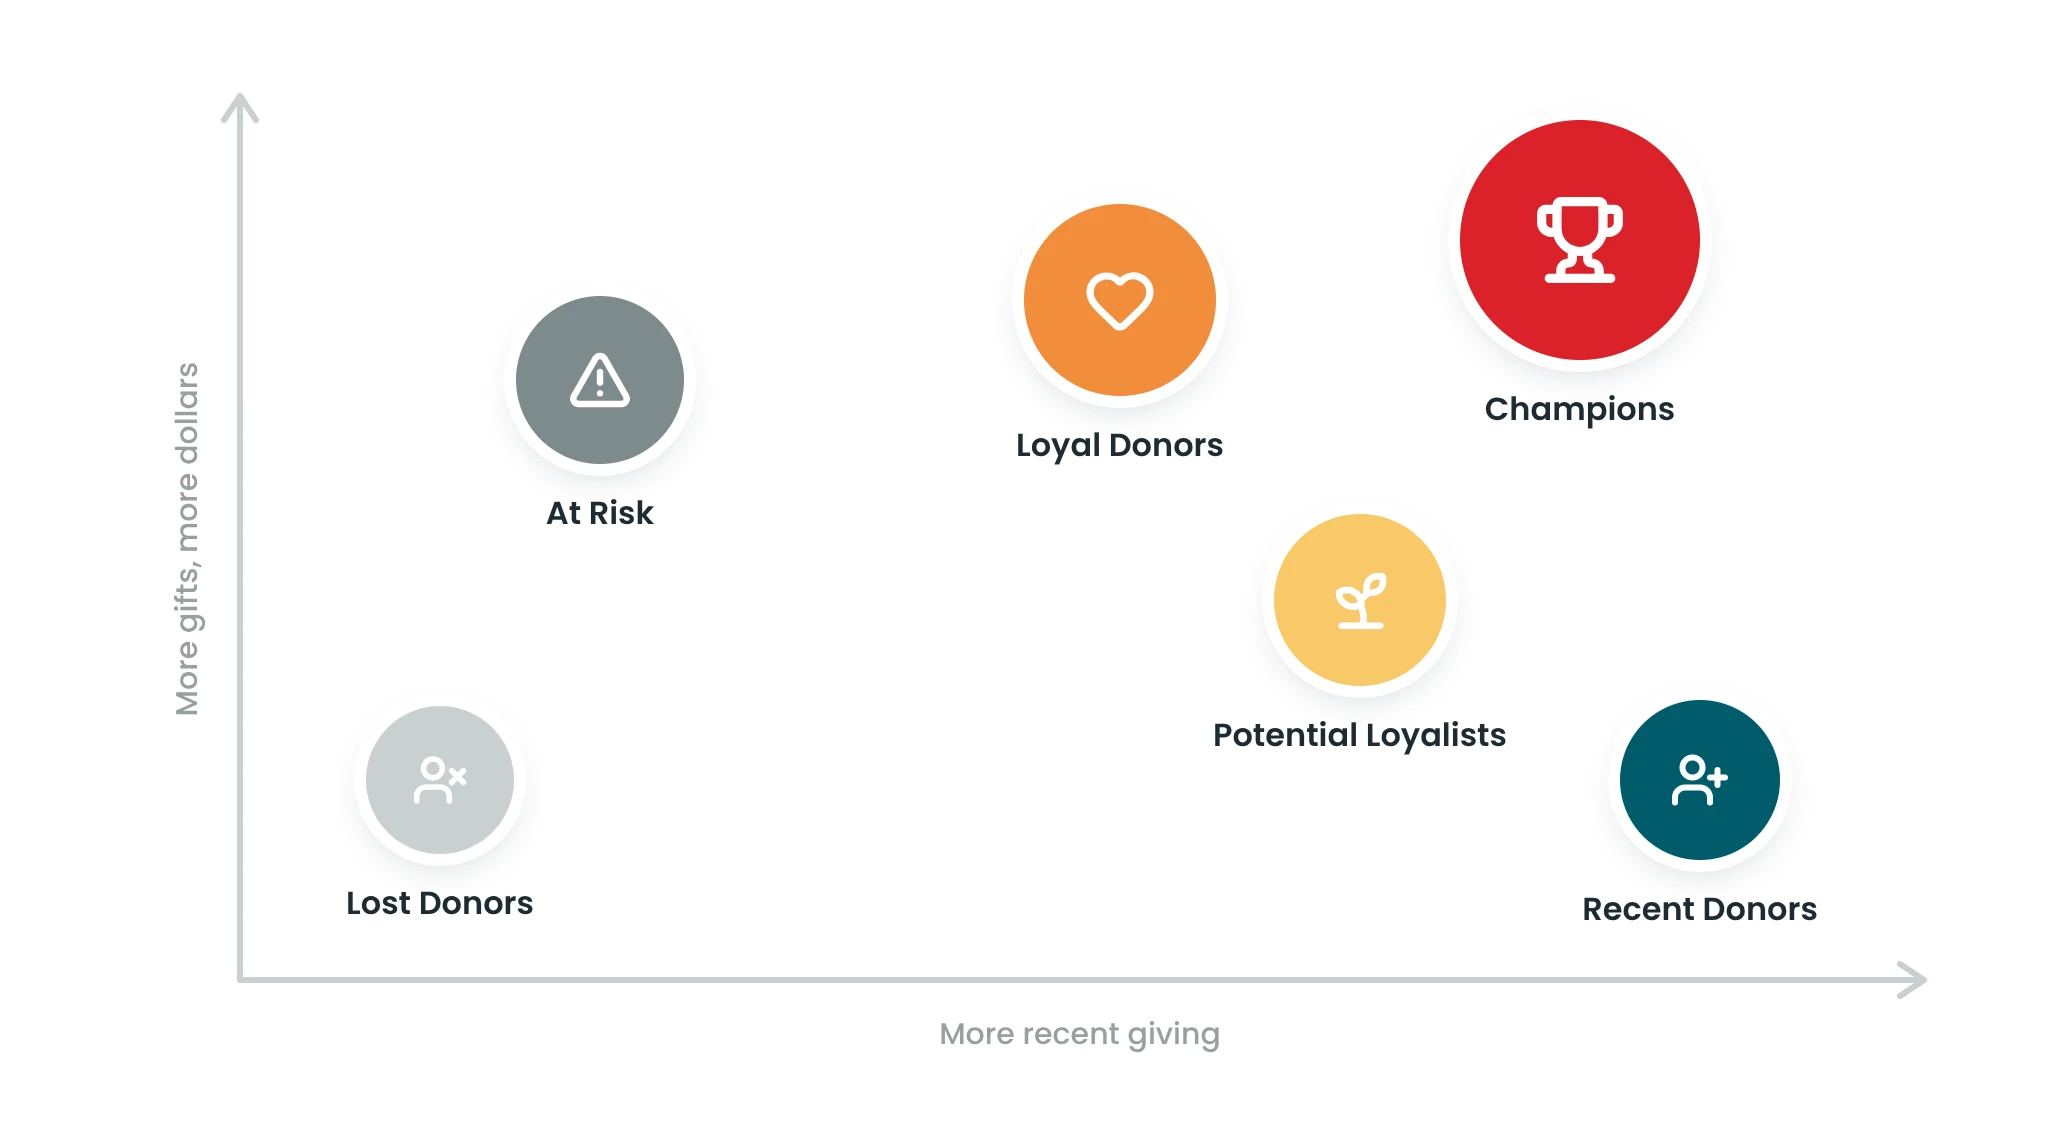
I expected this step to need a lot more direction from me. I said “yes, go ahead,” and here’s what it came up with:
- Champions: recent, frequent and high-value donors
- Loyal Donors: consistent givers with moderate value
- Potential Loyalists: moderate frequency, growing potential
- Recent Donors: new givers who need nurturing
- At Risk: lapsed or declining engagement
- Lost Donors: long inactive
At the time, that suggestion felt like a wow moment. Today, it’s what you should expect from a good AI assistant: it doesn’t just follow instructions, it proposes the next logical step.
A Few Things I’d Add Now
- Check the work. Spot check a handful of donors against the raw file before you act on any scores or segments.
- Mind your data. Follow your organization’s privacy and data policies before uploading donor information to any AI tool. A public dataset, like the one I used, is a safe place to practice.
- Ask for the reasoning. Have the AI explain how it set score cutoffs and defined each segment, so you can adjust them to fit your program.
What I Took Away
My brilliant colleagues are the ones who make the CharityCAN magic happen. But this simple experiment showed me how accessible RFM analysis can be with the right tools.
Curious about donor segmentation, RFM analysis or experimenting with AI? This is a low-barrier place to start. Just dive in.
Worst case, you learn something. Best case, you learn something and walk away with actionable data.