Introducing Prospect Profiles and Relationship Mapping
We are pleased to announce to our subscribers a new major feature to the CharityCAN platform: Prospect Profiles featuring Relationship Mapping.
By aggregating records from across our Charity Director and Corporate Canada datasets, we have built algorithmic profiles of potential prospects that attempt to bring together in one place all the known CharityCAN records on an individual.
We’ve then used these new profiles to map out the connections between potential donors in a relationship graph on each profile page. You can easily see the top connections an individual has through public corporations or charity directorships and navigate quickly and easily through the graph to view more profiles for those connections, or to see that person’s connections.
Links to these new profiles are accessible wherever we can link a search result to a profiled individual, or via the new “Prospect Profiles” results tab in the integrated search.
To view a prospect profile/relationship map:
- Enter a name into Integrated Search
- Click on the “Prospect Profiles” tab
- Click on “View Profile” beside the name of the prospect
A note about common names: In some instances, you will see several Profiles for the name you have entered into Integrated Search. These profiles may indeed be for the same person. A few clicks should establish whether this is the case or not.
Please note that relationships are determined from historical data, as well as current records. Individuals who appear in relationship lists may no longer be involved with the organizations listed. In some cases they may also be deceased.
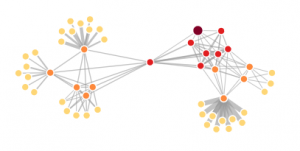
Example relationship graph
In the example graph above, the prospect is identified by the larger, dark red point. The prospects’ close relationships are identified by the red points, those individuals’ relationships identified by the orange points, and so on.
You can hover over any point in a Relationship Mapping graph to view details on the prospect it represents. Clicking on the point will pin the details to the graph for easy access. Clicking on the name of a charity or company then brings up relevant detailed information. You can also click and drag points around to easily explore other parts of the graph.
We hope you enjoy this new feature and look forward to building on it as we go forward. As always, we value your feedback so if you have any questions, comments or suggestions please contact us.